Turnaround in classic car auctions?
01/22/2019

With the US shutdown and the current turmoil around the world, the conditions were certainly not ideal for the first major auctions of 2019, which took place in Scottsdale as they do every year.
Bonhams, Gooding & Co and RM/Sotheby's offered over 400 cars over three days, with a total value of over 180 million USD. At the end of the days, the sales of the three auction houses added up to USD 100.6 million. This is an impressive sum, because broken down into the 342 vehicles sold, this amounts to USD 294,095 per lot. A crisis certainly looks different, even if 19 percent of the cars could not be sold. And even if these tended to be the more expensive ones.
The high proportion of "no reserve" lots, i.e. vehicles offered without a reserve price, was interesting. Around 63 percent of all cars on offer belonged to this category. One could easily come to the conclusion that this had led to a real sell-out. But it did not. Only just three percentage points less was offered on average and in comparison to the estimated values via the three auction houses for cars without a reserve price. At Bonhams and Gooding the difference was five percentage points, at RM/Sotheby's there was no measurable difference. Naturally, the cheaper cars tended to be offered "no reserve".
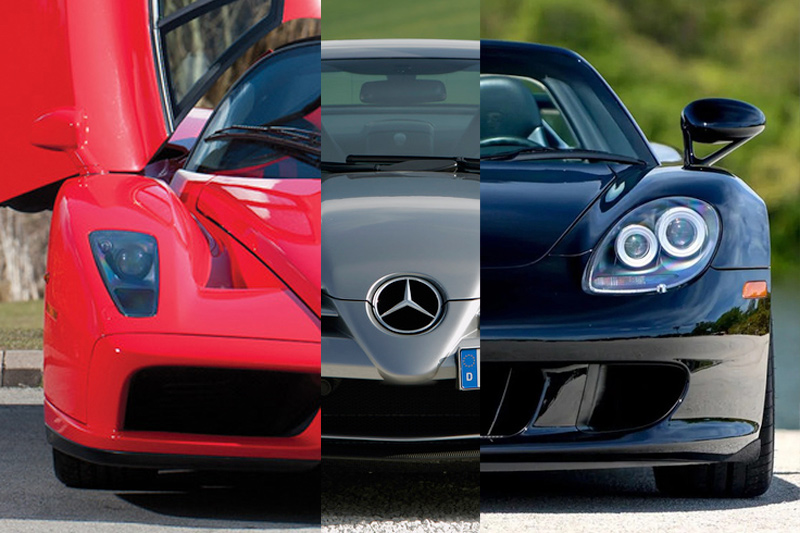
The comparative figures per vehicle brand are also impressive if you look at the number of vehicles on offer, the sales ratio (proportion of vehicles sold in the offer), the average deviation of the hammer price from the mean estimated value and the average hammer price (in USD). Although Porsche clearly had the most cars on offer, they were valued significantly lower on average than Ferrari cars. On the other hand, Porsche's sales rate of 92% was significantly better than Ferrari's 79%. Bentley was even more convincing than these two brands, however, as 91% of the cars were sold and a hammer price of 92% was achieved compared to the average estimated value.
The following table or the Zwischengas auction database can be used for further analysis .
| Brand | Brand of car | Sales rate | % Est | Average USD hammer price |
|---|---|---|---|---|
| Porsche | 66 | 92 % | 81 % | 191887 |
| Ferrari | 56 | 79 % | 79 % | 1165429 |
| Mercedes-Benz | 38 | 84 % | 74 % | 323081 |
| Rolls-Royce | 21 | 81 % | 73 % | 183643 |
| Ford | 18 | 89 % | 69 % | 120361 |
| Jaguar | 17 | 82 % | 78 % | 162088 |
| Bentley | 11 | 91 % | 92 % | 254318 |
| Chevrolet | 10 | 70 % | 70 % | 156000 |
| Packard | 10 | 100 % | 71 % | 140750 |
| Cadillac | 9 | 100 % | 75 % | 143111 |
| Shelby | 9 | 67 % | 78 % | 562222 |
| Alfa Romeo | 7 | 71 % | 76 % | 179643 |
| Aston Martin | 6 | 33 % | 74 % | 470833 |
| BMW | 5 | 100 % | 81 % | 467500 |
| Bugatti | 5 | 20 % | 79 % | 1086000 |
| Fiat-Abarth | 5 | 100 % | 76 % | 41000 |
| Maserati | 5 | 60 % | 75 % | 762000 |
| Volkswagen | 5 | 100 % | 87 % | 63300 |
| Buick | 4 | 50 % | 43 % | 21500 |
| Chrysler | 4 | 100 % | 56 % | 113625 |
| Lamborghini | 4 | 75 % | 81 % | 547125 |